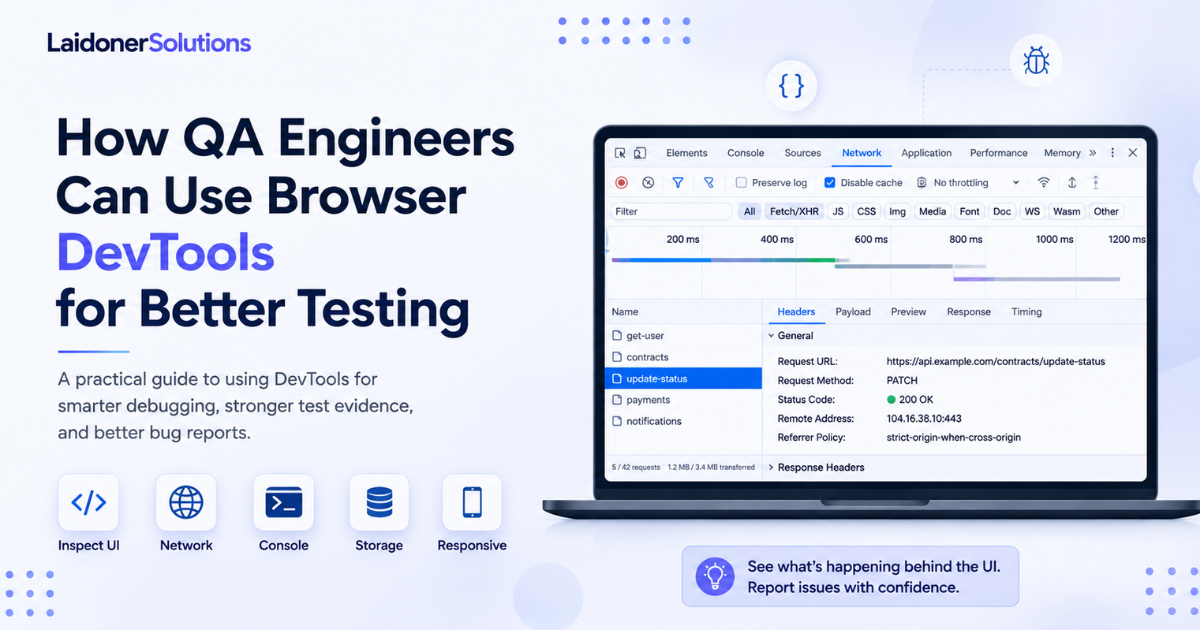

How QA Engineers Can Use Browser DevTools for Better Testing
Browser DevTools help QA engineers investigate beyond the visible screen by checking console errors, network requests, storage, layout behaviour, redirects, caching and frontend/backend mismatches.
Browser DevTools are not only for developers.
For QA engineers, DevTools can turn a vague bug into a clear report. They help you see what happened behind the interface: which request failed, which response came back, which data was stored, which error appeared in the console, which element broke the layout, or whether the problem is frontend, backend, data, configuration or environment related.
This does not mean every QA engineer needs to become a frontend developer.
But modern QA work is much stronger when testers can investigate beyond the visible screen.
A bug report that says “the page does not work” is useful only to a point. A report that says “the page fails after this API request returns 403 for this user role, while the UI still shows the action as available” is much more useful.
That is where DevTools help.
For QA, the value is simple: DevTools help you test with evidence.
Why DevTools matter for QA
A lot of product behaviour is no longer visible only in the UI.
A button may look correct, but the request behind it may fail. A success message may appear, but the backend may not update the data. A page may load slowly because one request is waiting too long. A language setting may seem saved, but only in local storage, not on the account.
A validation message may block the UI, but the backend may still accept the invalid payload if sent directly.
Without DevTools, QA often sees only the symptom.
With DevTools, QA can investigate the cause more clearly.
This is especially useful for API-driven products, SaaS dashboards, fintech or transaction flows, admin panels, user-role systems, forms, validation, login behaviour, session behaviour, localization issues, responsive layouts, third-party integrations and test environment problems.
The goal is not to overcomplicate manual testing. The goal is to make testing more precise.
1. Use the Elements panel to inspect UI and layout problems
The Elements panel lets you inspect the HTML and CSS behind the page.
For QA engineers, this is useful when something looks wrong but the cause is not obvious.
Text may be clipped. A button may be hidden. A modal may overflow on mobile. A disabled field may still be clickable. A dropdown may appear behind another element. A translated string may break the layout.
Instead of only saying “the layout is broken,” you can inspect the element and understand what is happening.
Useful checks include whether the element is actually present in the DOM, whether it is hidden, whether it is disabled, whether another element is covering it, whether text is overflowing because of fixed width, whether a button is outside the viewport or whether the wrong CSS class is applied.
Weak report: “The Continue button is missing on mobile.”
Better report: “On mobile width 390px, the Continue button exists in the DOM but is pushed below the visible modal area. The modal has no internal scroll, so the user cannot reach the button.”
That gives the developer a much better starting point.
2. Use the Console to catch frontend errors
The Console shows JavaScript errors, warnings and logs.
For QA, this is one of the fastest ways to check whether the UI is failing silently.
A page can look normal at first but still throw errors when the user clicks a button, opens a modal, submits a form or changes a filter.
Common console issues include uncaught JavaScript errors, failed event handlers, undefined values, React hydration errors, blocked resources, translation key errors, failed third-party scripts, permission-related frontend errors and errors after page refresh or navigation.
For example, a user clicks Save, nothing happens and no validation appears. With DevTools open, the Console shows: “Uncaught TypeError: Cannot read properties of undefined.”
That changes the report.
The issue is no longer just “Save does not work.” It becomes: “Clicking Save causes a frontend error in the console. The request is not sent. The form appears stuck with no user-facing error message.”
A practical QA habit is to open the Console before testing important flows and clear it before starting. Then perform the action and see if any new error appears.
3. Use the Network tab to understand API behaviour
The Network tab is one of the most valuable DevTools areas for QA.
It shows what the browser sends and receives.
This is especially useful when testing modern products because many UI actions depend on API calls.
QA engineers can use it to check whether the request was sent, which endpoint was called, which method was used, which status code came back, what payload was sent, what response body came back and whether the UI displayed the response correctly.
For example, a user clicks “Cancel contract.” The UI shows a success toast, but the contract status does not change.
Network investigation may show that the cancel request returns 200 OK, but the response still contains status “active.”
This suggests the UI showed success, but the backend did not actually return the expected product state.
Another example is when the backend returns a specific validation error, but the UI only shows “Something went wrong.” That is a product-quality issue because the user does not know what to fix.
4. Preserve logs when testing redirects and reloads
Many QA flows involve redirects, refreshes or page reloads.
Login, payment, email confirmation, OAuth, 2FA, checkout and account setup flows often move between pages.
If DevTools clears the Network log on navigation, you may lose the request that caused the problem.
Use Preserve log in the Network tab when testing flows that redirect or reload.
This helps with login redirects, OAuth flows, payment redirects, form submissions, email confirmation links, 2FA setup, failed account creation, session expiry and error pages after submit.
For example, a form submits and instantly redirects to an error page. Without preserved logs, the failed request may disappear. With preserved logs, you can inspect the original request and response.
That kind of evidence can save a lot of debugging time.
5. Use Disable cache when checking fresh behaviour
Caching can make testing misleading.
A page may look correct because old files are cached. A fix may look missing because the browser still has old assets. A bug may disappear after hard refresh.
CSS, JavaScript, images and API responses can all be affected by caching depending on the product setup.
When DevTools is open, the Network tab usually allows you to disable cache while testing.
Use it when checking fresh deployments, CSS fixes, image updates, translations, frontend bundle updates, stale UI behaviour, old API responses and redirect or route issues.
For example, a developer says a button label was changed, but QA still sees the old text. With cache disabled and a hard reload, the new label appears.
That is not a product bug. It is a cache-related testing condition.
QA should mention that clearly instead of reporting the wrong issue.
6. Test slow networks and offline behaviour
Users do not always have perfect network conditions.
DevTools can simulate slower network conditions or offline mode.
This is useful for testing loading states, retries, timeouts and error messages.
QA can check whether the page shows a loading state, whether the user can click the same button multiple times while waiting, whether the submit button is disabled during request processing, whether duplicate requests are sent and whether the product recovers after connection returns.
For example, a user submits a form on a slow network and clicks the submit button three times. The Network tab shows three POST requests.
That is a real issue.
A useful report could say: “On slow 3G throttling, the Submit button remains enabled after first click. Multiple clicks send duplicate POST requests. This may create duplicate records if the backend does not enforce idempotency.”
This is where DevTools helps QA find problems that normal happy-path testing may miss.
7. Inspect cookies, local storage and session storage
The Application tab in Chrome or Storage tools in Firefox can show cookies, local storage, session storage, IndexedDB and other browser-side data.
For QA, storage is useful because many products store state in the browser.
This can affect login sessions, language preference, theme preference, cookie consent, onboarding progress, referral codes, feature flags, temporary tokens, shopping cart data, recently viewed items, 2FA setup state and draft form data.
Useful checks include whether language preference persists after refresh, whether logout clears the right tokens, whether session expiry removes sensitive data, whether cookie consent stays saved, whether referral data survives signup and whether changing user clears previous user state.
For example: “After logging out from User A and logging in as User B, local storage still contains User A’s selected account ID. The dashboard briefly loads data for the previous account before refreshing.”
That is a serious QA finding because it touches state handling and possibly privacy.
8. Use responsive mode more carefully
Responsive mode is not only for checking whether the page fits on mobile.
It helps QA test layout, viewport behaviour, touch-like interaction, orientation changes and network conditions.
Useful checks include whether the menu opens and closes correctly, whether buttons are reachable, whether modals are scrollable, whether text is clipped, whether sticky elements cover content, whether the keyboard hides important fields and whether landscape mode breaks the layout.
Also check whether tables overflow properly, whether language strings remain readable and whether the flow works at common widths like 360px, 390px, 414px and tablet sizes.
For example, a desktop modal works fine, but on mobile the confirmation button is below the viewport and the modal cannot scroll.
That is not just a visual issue. It blocks the user from completing the flow.
A useful report says: “On 390px mobile viewport, the confirmation modal content exceeds screen height. The primary action button is not reachable because the modal body does not scroll.”
9. Use simple console scripts for faster checks
QA engineers can use small JavaScript snippets in the Console to speed up repetitive checks.
These are not full automation. They are lightweight investigation helpers.
For example, you can count buttons and links, find disabled buttons, find empty links, find images without alt text, check whether visible text appears, inspect local storage or clear local and session storage when checking first-time user behaviour.
The point is not to turn every QA engineer into a JavaScript expert.
The point is to use small scripts to reduce repetitive manual checking and collect better evidence.
Used carefully, these small helpers can make exploratory testing faster and more precise.
10. Test frontend validation against backend behaviour
DevTools are especially useful for validation testing.
A common mistake is checking only what the frontend allows.
For example, a form blocks invalid input in the UI. That is good, but it does not prove the backend rejects the same invalid data.
Users normally interact through the UI, but APIs can still receive malformed or manipulated requests.
QA should check both layers when the risk is important.
Frontend validation improves user experience. Backend validation protects the system.
The UI may block a payment password shorter than 8 characters, but QA should still ask whether the backend rejects the same invalid value if the request is sent directly or modified.
This can be investigated using Network evidence, API tools or controlled testing with developer support.
11. Use request and response evidence in bug reports
DevTools make bug reports stronger because they provide evidence.
A strong report may include a screenshot or video, browser and environment, user role, request URL, request method, status code, request payload, response body, console error, timestamp, whether the issue reproduces after refresh and whether cache was disabled.
For example, instead of only reporting that contract cancellation does not work, the report can say that the UI shows a success toast, but the cancel request returns 409 with an error explaining that the contract cannot be canceled after payment started.
That changes the quality of the finding.
The team can understand the mismatch between the UI feedback and backend state.
This is much better than only saying “cancel does not work.”
12. Use DevTools to separate frontend, backend and environment issues
One of the biggest QA benefits of DevTools is better classification.
You may not always know the final root cause, but you can often narrow it down.
If the button does not trigger any request and the Console shows an error, it may be frontend.
If the request is sent but returns 400, 401, 403, 409 or 500, backend, permissions, validation or state logic may be involved.
If the request succeeds but the UI displays the wrong result, it may be frontend state handling or response mapping.
If the issue appears only on staging and not another environment, environment configuration or data may be involved.
If the issue appears only with one user role, permissions or role-specific logic may be involved.
If the issue appears only after refresh, storage, caching or initial load state may be involved.
This is not about pretending QA knows everything. It is about giving the team better information.
13. Use DevTools carefully
DevTools are powerful, but QA engineers should use them responsibly.
Changing local storage, editing HTML, overriding CSS, blocking requests or modifying scripts can create conditions that normal users do not experience.
That can still be useful, but it should be clearly stated in the report.
For example: reproduced through normal UI flow, reproduced only after manually clearing local storage, observed after blocking API request in DevTools, tested with slow network throttling, modified payload sent through API client or frontend prevented this action and backend behaviour was not verified.
This distinction matters.
A bug found through normal user behaviour is different from a bug found through artificial manipulation.
Both can be valid, but the team needs to know the test condition.
Where Laidoner Solutions uses this approach
At Laidoner Solutions, DevTools are part of practical QA investigation.
They help turn manual testing into clearer product feedback.
When testing web applications, SaaS platforms, API-driven products or complex user flows, browser evidence can show whether the problem is in the UI, API response, user role, data state, storage, configuration or test environment.
This supports manual QA, exploratory testing, regression checks, API validation, frontend/backend mismatch investigation, form validation testing, responsive layout review, localization QA, release risk summaries and clear defect reporting.
The goal is not to make testing more complicated.
The goal is to give software teams feedback they can actually use.
Practical DevTools checklist for QA engineers
Before testing a critical flow, open DevTools, clear the Console and open the Network tab.
Enable Preserve log if the flow redirects. Disable cache if checking a fresh deployment. Confirm the correct environment. Check the user role and account state.
Perform the test slowly enough to observe behaviour.
Check failed requests, response bodies and Console errors.
Record evidence before refreshing.
Include relevant technical details in the bug report.
This small habit can improve the quality of QA reports quickly.
Final thoughts
Browser DevTools help QA engineers see more than the screen.
They show the system behind the interface: requests, responses, stored data, errors, layout rules, loading behaviour and environment clues.
That does not replace product thinking. It supports it.
Good QA is still about asking the right questions: what should happen, what actually happened, who is affected, how serious is it and what risk does it create?
DevTools simply help answer those questions with better evidence.
A QA engineer who can use DevTools well is not just reporting symptoms.
They are helping the team understand the problem.
Sources and further reading
Need practical QA support?
Laidoner Solutions helps software teams with manual QA, API testing, localization review, release checks and clear defect reporting.
Contact Us